

How Induced Demand Actually Works
Using the four stages of Travel Demand Modelling to understand the mechanism of induced demand

Induced demand is a tricky thing to understand. This is, in part, because it is unintuitive. Why would creating a additional supply (like widening a highway), not only lead to more demand, but to the degree where there is no improvement in the quality of the network? While there is no question that induced demand is real (we can just look at the long-term results of road/highway projects), the misunderstandings of the mechanism of how it works can sometimes seem to be shared by those who believe in it and those who do not.
One useful way to understand the “how” of induced demand is to look at it through the lens of “travel demand modelling”, the method that transportation planners use to understand changes in travel due to physical or demographic changes in an area. The four stages look like this:
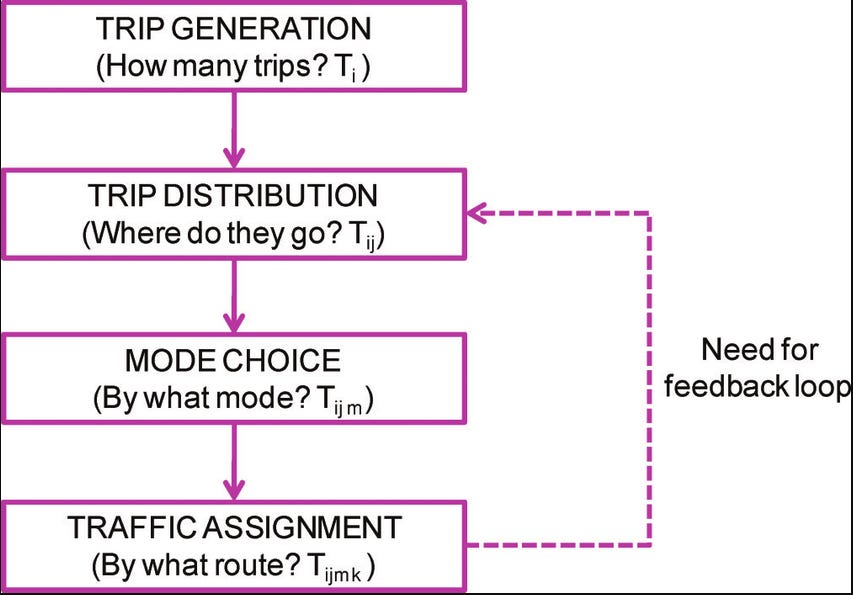
Trip Generation: How many total trips are made across a network. This could use census, travel diary or other data, and may also include forecasted population changes.
Trip Distribution: Where are all these trips starting and ending? For example, for the AM peak times, housing may generate the origin of a trip and an area of high employment may be the end.
Mode Choice: Which mode is each trip taken by. This is often determined by models that estimate what the probability is that someone will take a certain mode (car, transit, walk, etc.) due to demographic (e.g. car ownerships, income, etc.) and physical characteristics (travel time, fare cost, etc.).
Traffic Assignment: Mainly for vehicles, the model then assumes everyone is trying to find the fastest way to their destination and assigns the routes on this basis. However, if everyone chooses the “fastest” route, it causes additional congestion and is no longer the fastest. Therefore, this is an iterative process until an equilibrium is met.
Often, people will only think of the direct impact a network change will have. For example, a new lane is added to a highway, which relieves congestion, and travel times go down. However, over time, people adapt their habits to these “improvements” and THAT’S when induced demand happens. When a change to a transportation network is made, changes will be seen immediately, and then more quickly at the bottom of the demand model stages, with the top of the stages taking more time to be seen. The most common type of network changes associated with induced demand are highways, and highway widening. Let’s use these examples to explore how they would impact travel demand and travel times in an area from the bottom up.

Traffic Assignment: For a large project, drivers may often start to change their routes within weeks or even days but it may take many months for people to learn about better routes. Once they do learn about the quicker routes, they will move to it, and the added vehicles could again create additional congestion that was not anticipated.
Mode Choice: If there are still travel time savings after new traffic assignments, riders that use other modes (often transit) will begin to consider if it may be worth changing to driving to their destination since it seems quicker, and at least some congestion that was there was previously there is now relieved. This change takes time to see, often at least a year, since this is a big change for an individual and could be influenced by individual factors such as them already owning a vehicle.
Trip Distribution: Will people actually start to choose to take trips to and from different places because of new infrastructure? It may seem silly but if you are looking for groceries and one store has time savings over another you might consider it, particularly if the savings are significant like the addition of a new highway. While these changes may be seen quickly for something like going to the grocery store, changes such as place of employment or residence can take a lot longer to see. It could take years or decades to see the full impact. On top of this, housing and business developments may be placed around new infrastructure which creates additional demand. The impact of these changes on travel demand could have a massive negative impact on a city but it can be hard to prove causality due to the time it takes this to be seen.
Trip Generation: People may take different trips because of a new highway, but how would it generate more trips system-wide? It may if there are any real travel time savings left after all the steps above, however, this will be observed more on a network level, considering many infrastructure changes that may happen over time. For example, large investments in highways across a growing city can seem amazing to someone considering moving to a city since it seems so easy to get around with their car. However, over many decades, the demand far outpaces what the network can hold. This is the similar story to many North American cities like Toronto that saw people using cars to get everywhere unfettered for a long time until it became unpractical and inefficient.
One of the things that makes induced demand so insidious is that it’s effects are not seen immediately and the worst ones, that can entrench bad land use and infrastructure the most, take the longest to happen. It’s important to understand this process because proponents of bad infrastructure will often speak to their immediate benefits. Instead of downplaying them, we need to be speaking about how this is shortsighted and actually makes things worse in the long term, otherwise it sneaks up on you with no one really understanding what just happened.